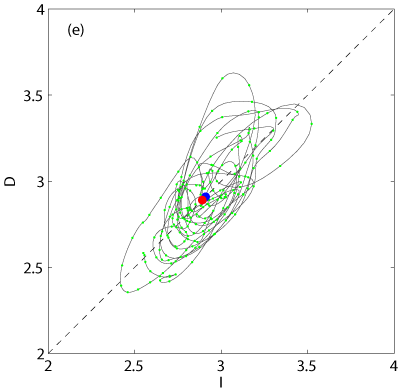
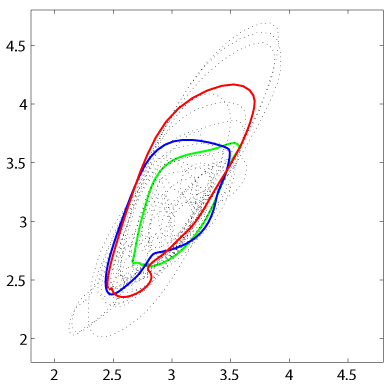
5. Energy-dissipation visualization of Navier-Stokes solutions3D movies give no hint of relative importance of, and interrelations between different exact invariant solutions. Some physical insights on this are gained by studying the energy E, power input I (shearing motion of the walls) and bulk dissipation rate D of various solutions:
|
|
|
These projections from 61,506 dimensions to 2 dimensions help us eliminate equilibria that lie outside regions frequented by the turbulent trajectory as physically unimportant, and suggest that the above periodic orbits are typical of turbulent motions. The expression for the total kinetic energy of fluid contained within the cell suggests, however, a much more versatile visualization framework. |
|
|
|
|